100% Software • Zero Additional Hardware

Make solar energy visible on any screen.

Connect your existing solar installation to our cloud and transform technical data into high-impact visual experiences.

Your Current Plants
Solar Inverters
SolarEdge Enphase Fronius Solar-Log +50 brands
Direct extraction
Sunnection
Cloud

Real-time processing & visualization engine

To all screens
Premium Display
Any Screen
TV
42.8 kW
Tablet
🌳
1,240 trees
Mobile
124 kWh

Trusted by leading organizations worldwide

TechCorp
GreenEnergy
CityPower
SolarCo
SmartGrid

First impressions matter

Showcase your commitment to sustainability with Sunnection
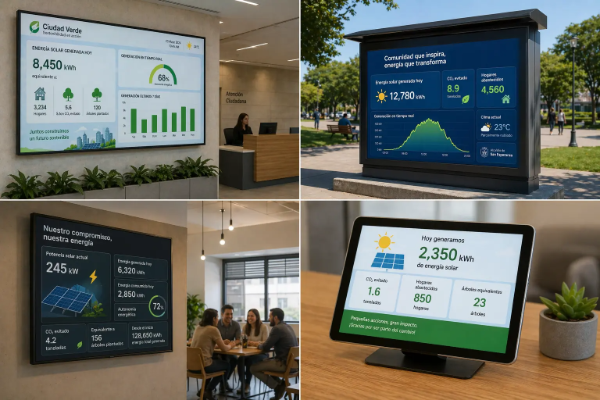
Corporate lobbies

Corporate lobbies

Receptions & waiting rooms
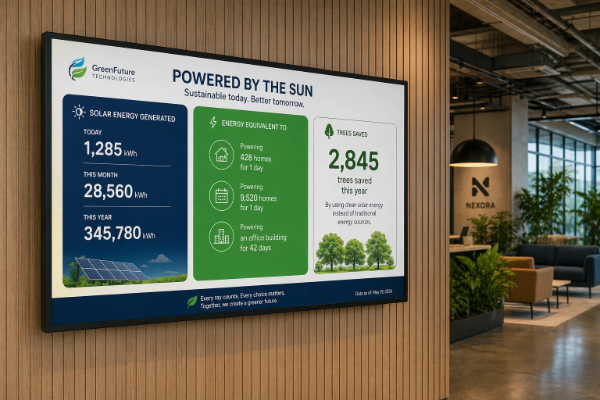
sunnection
Building entrances

Building entrances

Facades & main entrances
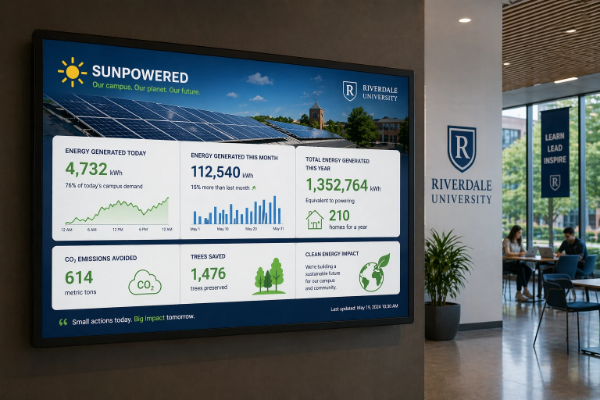
sunnection
Public spaces

Public spaces

Plazas, avenues & urban areas

sunnection
Features

Everything you need to visualize energy

Replace expensive hardware solutions with a modern, cloud-based platform that scales with your needs.

Connect Any System

Integrate with any solar inverter, energy meter, or data source via API. Support for SolarEdge, Enphase, Fronius, Solar-Log, and more.

Real-Time Dashboards

Beautiful, responsive dashboards that update live. Display production, consumption, savings, and ESG metrics instantly.

No Hardware Needed

Pure software solution. No expensive display hardware or dedicated servers required. Deploy in minutes, not months.

Customizable Design

Match your brand with custom themes, colors, and layouts. Full control over what data to display and how.

Public Display Ready

Optimized for large screens, kiosks, and lobby displays. Auto-refresh, screensaver mode, and remote management.

Web Embedding

Embed dashboards anywhere with a simple iframe. Perfect for websites, intranets, and digital signage networks.

How It Works

Get started in three simple steps

From data connection to live dashboard in minutes. No technical expertise required.

01

Connect Data

Link your solar inverters, energy meters, or any data source using our simple API integration or pre-built connectors.

02

Customize Dashboard

Choose from beautiful templates or build your own. Select metrics, charts, and layouts that match your needs.

03

Display Anywhere

Share via URL, embed on websites, or display on screens and kiosks. Update remotely, manage from anywhere.

Use Cases

Built for every industry

From small installations to large-scale deployments, Sunnection scales to meet your needs.

Corporate Offices

Showcase sustainability efforts in lobbies and common areas. Engage employees with real-time energy data.

500+ offices worldwide

Universities

Educate students about renewable energy. Display campus solar production in real-time across buildings.

200+ campuses

Energy Companies

Professional dashboards for client portals and showrooms. White-label solutions for energy providers.

50+ utilities

Smart Cities

Public displays showing municipal renewable energy production. Transparent sustainability reporting.

100+ municipalities
Benefits

Transform how you communicate energy

Modern organizations need modern solutions. Stop using outdated hardware and start leveraging cloud-based software.

3x
Higher engagement

Increase Sustainability Awareness

Make invisible energy visible. Help stakeholders understand your renewable energy impact through clear, real-time visualizations.

85%
Better ESG scores

Improve ESG Communication

Transparent reporting of environmental metrics. Perfect for annual reports, investor presentations, and public commitments.

10x
More interactions

Engage Users

Interactive dashboards that captivate viewers. Turn lobbies and waiting areas into educational experiences about sustainability.

80%
Cost reduction

Replace Hardware Solutions

No more expensive display hardware, custom integrations, or maintenance costs. Software-only solution that works on any screen.

Join 1,000+ organizations making energy visible
Pricing

Simple, transparent pricing

Transparent pricing, no hidden fees, no hardware costs. Scale as your display needs grow.

Starter

Perfect for small installations

$49 /month
  • Up to 3 screens
  • 2 data sources
  • Real-time updates
  • Basic templates
  • Email support
  • Web embedding
Request Preview
Most Popular

Pro

For growing organizations

$149 /month
  • Up to 15 screens
  • 10 data sources
  • Real-time updates
  • Custom templates
  • Priority support
  • Web embedding
  • White-label option
  • API access
  • Advanced analytics
Request Preview

Enterprise

For large-scale deployments

Custom
  • Unlimited screens
  • Unlimited data sources
  • Real-time updates
  • Fully custom design
  • Dedicated support
  • Web embedding
  • White-label included
  • API access
  • Advanced analytics
  • SLA guarantee
  • Custom integrations
Request a Demo

All plans include a guided onboarding • Custom preview before you commit

✓ $10/month per additional screen ✓ $25/month per additional data source ✓ Volume discounts available
FAQ

Frequently Asked Questions

Everything you need to know about Sunnection. Can't find what you're looking for? Reach out to our team.

Sunnection is a software platform that turns solar energy data into beautiful, easy-to-understand visual displays for schools, universities, companies, public buildings, and other organizations. It helps you show real-time solar production, environmental impact, and sustainability achievements on screens, kiosks, or web-based displays.
Sunnection connects to your existing solar monitoring platform, inverter portal, data logger, or energy data source. It collects the data, transforms it into clear visual content, and displays it through customizable templates on your screens or web players.
No. Sunnection is designed as a software-first solution. You can use your own screens, smart TVs, browser-based players, kiosks, or digital signage devices instead of buying proprietary display hardware.
Sunnection can display solar production, current power output, daily, monthly, and yearly generation, CO₂ avoided, energy equivalents, energy consumption, battery/storage data, grid import/export, and custom sustainability metrics depending on the data available from your system.
Yes. Sunnection can show data from one site or multiple solar installations. Data can be displayed separately by location or combined into a single portfolio view, which is useful for organizations with several buildings, campuses, or facilities.
Sunnection currently supports SolarEdge, Enphase, Fronius, and Solar-Log. We are actively adding many more integrations to support a broader range of solar monitoring platforms, inverter portals, data loggers, and energy data providers. Availability may depend on API access, account permissions, and each provider's integration rules.
Yes. Sunnection is built around customizable templates. You can adapt colors, logos, backgrounds, messages, layouts, and sustainability metrics so the display matches your brand and communication goals.
Yes. Sunnection can include custom text, images, videos, announcements, website embeds, news, event information, ESG messages, and educational content. This makes it useful not only as a solar dashboard, but also as a sustainability communication and digital signage tool.
Sunnection is ideal for schools, universities, companies, municipalities, public buildings, nonprofits, energy providers, EV dealerships, and any organization that wants to make its renewable energy impact visible to visitors, students, employees, or customers.
Solar is the main focus, but the platform can be extended to show other sustainability or energy-related data, such as consumption, storage, grid usage, EV charging, environmental impact metrics, or other renewable energy sources when data is available.
Yes. Sunnection is especially useful for education. It can help students and visitors understand how renewable energy works, how much energy a building produces, and what that means in real-world environmental terms such as CO₂ avoided, trees saved, or homes powered.
Yes. Sunnection can provide web-based display views or embeddable dashboards so your solar impact can be shown not only on physical screens, but also on your website or internal portals.
Update frequency depends on the data source and integration method. Some providers allow frequent updates, while others may update every few minutes, hourly, or daily. Sunnection uses the best available update interval supported by your system and data provider.
No. Sunnection is designed to be managed from a browser. Your team should be able to update templates, messages, images, and display settings without needing engineering support.
Yes. Each location can have its own display, branding, templates, and content. A central admin team can manage multiple locations while still allowing each site to show its own solar data and local messages.
Traditional solutions often combine software with proprietary hardware. Sunnection focuses on being software-only, flexible, and hardware-independent, so organizations can use existing screens and modern web-based players. This creates a lighter, more scalable deployment model.
Yes. Sunnection helps organizations communicate their environmental impact in a visual and public way. Instead of keeping solar data hidden inside technical portals, Sunnection turns it into clear stories for visitors, customers, students, and employees.
You typically need access to your solar monitoring platform or data provider, at least one screen or web display environment, your branding assets, and a basic idea of what you want to communicate: production, impact, education, ESG, or all of the above.
Yes. A custom preview is one of the best ways to see how Sunnection could look for your building, campus, or organization using your branding and example solar data.
See your solar data come to life

Ready to make your energy visible?

Share a few details and we'll build a custom preview showing how your solar data could look on any screen.

No commitment
Tailored to your site
Expert follow-up

Get a Custom Preview

Share a few details about your site and we'll show how your solar data could look on a public-facing display.

This site is protected by reCAPTCHA and the Google Privacy Policy and Terms of Service apply.